
NL · 6 March 2023
Suspicion Machines: Rotterdam's welfare fraud risk score
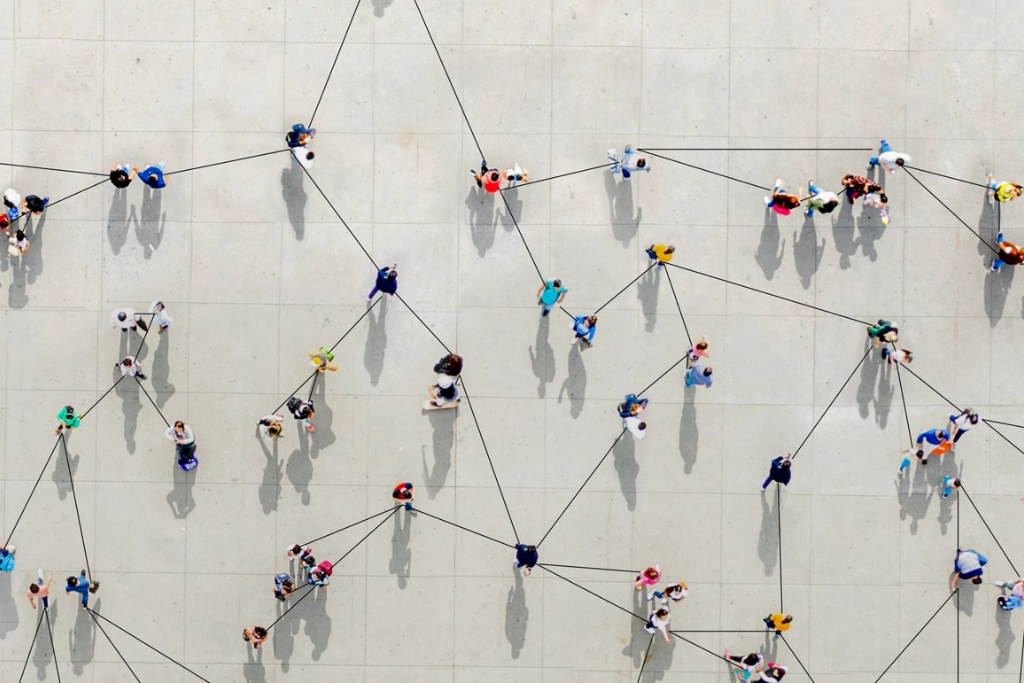
Image: Lighthouse Reports, from the original investigation. All rights reserved by the owner.
- Reported by
- Lighthouse Reports, WIRED, VPRO Argos, Follow the Money, Vers Beton, Open Rotterdam, Center for Artistic Inquiry and Reporting, Pulitzer Center
- Story language
- EN · NL
- Methods
- FOI / records request
- Code or model obtained
- Data analysis
- Interviews and surveys
Rotterdam ranked every welfare recipient by fraud risk with a machine-learning model, and journalists did something that almost never happens: they got hold of the model itself and took it apart. They found it scored parents, young people, women and people with weaker Dutch higher, and that it was only about 50 percent more accurate than random selection. The city had already put it on hold, and later agreed the Dutch-language variables were an unacceptable proxy for migrant background.
lighthousereports.comSuspicion Machines: Rotterdam's welfare fraud risk scoreA machine-learning model (gradient boosting, built with Accenture, 315 input variables) that ranked every welfare recipient in Rotterdam by fraud risk. The top decile, on average about 1,000 people a year, was referred for investigation.Netherlands · Reported by Lighthouse Reports, WIRED, VPRO Argos and others (opens in a new tab)How they investigated
- Methodology: Suspicion Machines: Rotterdam's welfare fraud risk score (opens in a new tab)
- Reusable code: Suspicion Machines: Rotterdam's welfare fraud risk score (opens in a new tab)
FOI / records request
More than 100 requests across about a dozen countries over two years. Of dozens of cities contacted, Rotterdam was the only one to share its code. After formal and informal requests, months of negotiation and the prospect of court action, it also handed over the trained model file.
Code or model obtained
The team received the source code, the list of variables, performance evaluations, the data scientists' handbook and the model file. The city refused to share the training data, but pseudonymised rows of it were accidentally left in the code of histogram files it sent. That let them take the model apart from the inside instead of only looking at its outputs.
Data analysis
They scored copies of the training data with one characteristic changed at a time, for all 315 variables, and compared who ended up above the high-risk line (statistical parity and controlled statistical parity). They repeated the tests on synthetic data and built profiles ('archetypes') such as a financially struggling mother and a migrant worker.
Interviews and surveys
More than a dozen interviews with people who had been investigated shaped which archetypes were tested.
Read alongside
SE · 2024
Sweden's Suspicion Machine: the Social Insurance Agency's parental benefit risk modelRotterdam shows what you can learn with the model but without outcome data. Sweden is the opposite: outcome data but no model.
NL · 2025
The Limits of Ethical AI: Amsterdam's Smart Check welfare pilotRotterdam shows what you can learn once you hold the model. Amsterdam shows what you can learn when the agency cooperates but will not hand over the data.